Report Studio
Report Studio builds visual reports from your databases: KPIs, line and bar charts, tables and text, on pages you can share as an HTML page, PDF, image or spreadsheet. Every query a report runs is read-only.
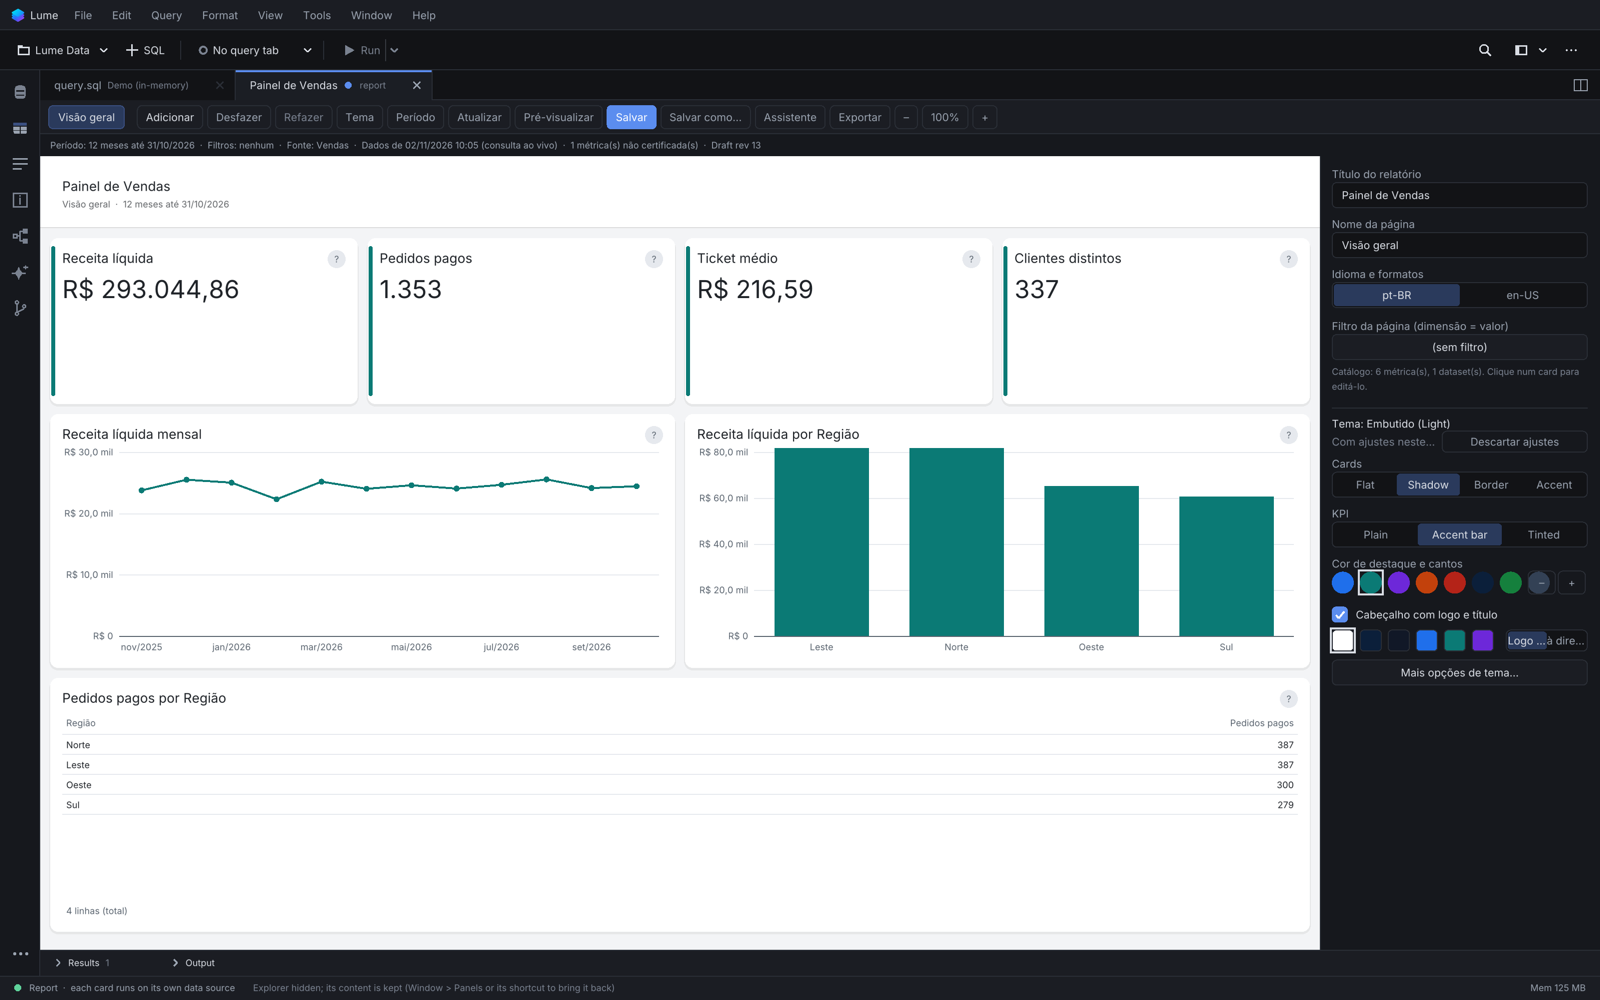
Create a report
| From | How |
|---|---|
| A blank page | Tools > Reports > New Report (also File > New Report) |
| A question in words | Tools > Reports > New Report from a Question...: Lume Intelligence drafts the first page for you to review |
| A query you ran | run a SELECT, then Tools > Reports > Add Result to Report: the result becomes a table card that keeps its SQL |
Tools > Reports > Open Report... (or File > Open Report...) opens a saved one. Reports are .lrpt files; File > Open... opens them too.
The report tab
The toolbar: Add, Undo, Redo, Theme, Period, Refresh, Preview / Edit, Save, Save As..., Assistant, Export and More.... When the tab is narrow, buttons that do not fit are hidden.
- Add > KPI, Line, Bars, Table, Text / note, or New page.
- Cards sit on a grid: drag to move, drag the corner to resize; they snap and push others down. Lock position and content (card properties) keeps a card in place. Delete removes the selected card.
- Select a card to edit its properties on the right: title, subtitle, visual type, its data, number format and style.
- Undo / Redo (Cmd+Z / Shift+Cmd+Z) cover every change, including the assistant's.
- Preview shows the report as readers see it.
See Cards, data and filters and Themes and export.
Saving
- Save writes the report; each save also keeps a numbered revision next to it.
- Unsaved changes are autosaved. After a crash, or closing without saving, Open Report... recovers them ("Recovered from the autosave").
- The language and number / date format of new reports come from Settings > Reports (Português (pt-BR) or English (en-US)); each report keeps its own. Some of the report tab's own labels follow the report's language.
How a card is calculated
Every card has Como foi calculado? ("how was this calculated?"): the source (a catalog metric with its version, or the card's SQL), the query that ran, when it ran and the filters applied. Cards whose SQL was written by the AI say "AI-written SQL · not certified".
Read-only by design
Report queries are checked before they run: one statement, SELECT / WITH only, no writes, no functions with side effects. They then run inside a read-only transaction that is always rolled back (SQL Server has no such transaction; Lume says so, and a read-only login is recommended there). Each query has a 30-second timeout and returns at most 10,000 rows. Results are cached, so changing a chart's type, the theme or undoing never queries again.
Not available yet
A rich text editor for text cards (they use one line, | for a new line and - for a bullet), scatter, stacked or heatmap charts, templates, a native vector PDF (use the HTML page and your browser's Print > Save as PDF), comparing saved revisions in the app, and publishing or scheduling reports.